Taking into consideration the large intrinsic variability of estuarine and coastal systems and the importance of ecosystem functioning within a water body, Ysebaert & Herman (2003) advocate a
multilevel scale-dependent approach for the classification of the quality elements in coastal and transitional waters.
The BEQI method adopts the ecosystem approach which encompasses the essential structure, processes, functions and interactions among organisms and their environment. Basically the method aims at integrating two aspects that are neglected by many other approaches: the functional role of benthos (e.g. highly productive benthic populations may be very important for the conservation of bird populations) and, secondly, the vulnerability to physical changes in the environment (e.g. dredging, land reclamation, harbor construction etc.).
A habitat specific approach is furthermore strongly recommended by Prior et al. (2004) in their guidance document for the application of the WFD to marine benthic communities, because coastal and especially transitional waters are characterized by highly variable physicochemical and hydro-morphologic conditions, resulting typically in a mosaic of different habitats. These habitats differ in (community) structure and function, and as such will show wide variations in statistics or measures between habitats. As such, the water body can not be evaluated as one identity, but the evaluation has to focus on the different habitats for the ecological assessment of the benthic communities.
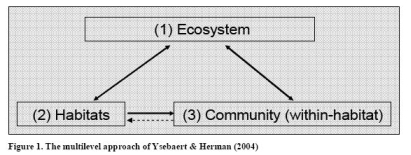
The multilevel approach proposed by Ysebaert & Herman (2004) consists of three levels:
(1) level 1 - Ecosystem level: On the level of the whole ecosystem (; e.g. a water body) one can evaluate if the benthic macrofauna fulfils the functional role one might expect given the current ecological circumstances. At this level also integration with other quality measures is most appropriate, and information on the water body can be summarised.
(2) level 2 - Habitat level: On the subsequent level the distribution of habitats (habitat completeness and complexity) can be evaluated. The size, shape, and spatial relationships of these habitats influence the dynamics of populations, communities, and ecosystems.
(3) level 3 - Community (within habitat) level: Finally the biological quality of each distinguished habitat based on benthic macrofauna can be evaluated (community level within-habitat), with indicators that are sensitive to different types of stress and that can explain possible deviations. The overall metric primarily aims at providing a signal that is capable of showing significant changes/deviations from a certain reference state. The different levels will be explained further on in detail.
At the ecosystem level, the BEQI uses the relationship between macrobenthic biomass (B) and system productivity (P, sum of fytoplankton and microfytobenthos), as was demonstrated by Herman et al. (1999) based on a series of estuarine and coastal systems worldwide.
This relation implies that for these shallow, well mixed, systems between 5% and 25% of the annual primary production (pelagic and benthic) is consumed by macrobenthos. The rest of the production is either consumed by pelagic grazers or directly incorporated into the microbial food web after decaying of the algal bloom.
A B:P ratio of 1:10 is used as the reference ratio between the system primary production and the macrobenthic biomass (Escaravage et al. 2004).
This ratio may represent a state of equilibrium where the sum of pelagic and benthic primary production is adequately matched by the biomass of grazers that are present in the system (i.e. macrobenthos and zooplankton).
Deviations from this relation could point at unbalanced ecosystem functioning (Ysebaert et al. subm.) and were scaled according to the WFD definitions.
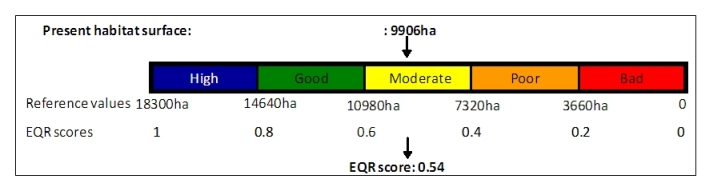
At the second level the BEQI considers the spatial distribution of habitats within an ecosystem. At this level one addresses the diversity of habitat types, and compares the availability and spatial organisation of these types to an expected reference state, based on the physical and geomorphological constraints of the system. When applying this indicator to the WFD, BEQI uses currently the surface area (spatial extent) of habitats as criterion at this level.
The BEQI also includes eco-elements, these are habitats constituted of species that form conspicuous biogenic structures, in coastal and estuarine soft-sediment systems typically formed by e.g. mussel beds, oyster reefs. The current status can be evaluated against a certain historical reference period, expert judgment or against the management objectives for a certain water body, evaluating as such the physical changes in the water body due to human activities: habitat loss due to land reclamation or infrastructural works, morphological changes due to dredging, etc. The deviations from the reference are scaled according to the WFD definitions.
Level 3 - Community (within habitat)___________________________________________
At the third level the BEQI analyses and evaluates the benthic macrofauna community per habitat or ecotope. Threshold values defined for each parameter delimit condition classes wherein a characteristic benthic community is expected to occur.
The BEQI level 3 uses four biological parameters: number of species, total density (ind.m-2), total biomass (g AFDW.m-2), and similarity (Bray-Curtis similarity based on 4th root transformed density data). The similarity index compares the assessed species composition (species and their densities) with a reference species composition. Each parameter gives different information about the structure and functioning of the benthic community (Ysebaert et al. subm.).
The BEQI evaluates the benthic community at the level of a habitat or ecotope, rather than the evaluation of a single sample. This requires a certain amount of reference and assessment samples and sampling area per habitat or ecotope, and this allows the incorporation of natural variability (spatial and temporal). A power analysis is used to detect the minimal number of samples or sampling surface required given an acceptable level of confidence.
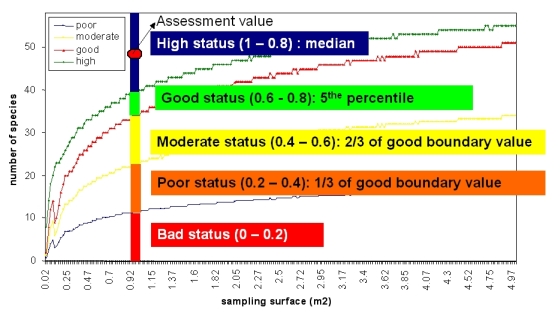
The BEQI takes into account the total sampling surface within a certain habitat or ecotope, as the parameter results will strongly depend on the sediment surface sampled (Ysebaert et al. subm.). Therefore, the expected reference values for the BEQI parameters are calculated per habitat or ecotope from permutations executed over increased sampling surfaces. An algorithm was used that computed rarefaction curves using a random resampling procedure with replacement (i.e. bootstrapping, using 2000 random samples).
This allows estimating, for any given sampling surface, the reference value that can be expected, which then can be compared with a similar sampling surface used to evaluate the current ecological status. Such reference boundary distribution over increasing sampling surface is illustrated below in the figure on the right for the parameter 'number of species'.
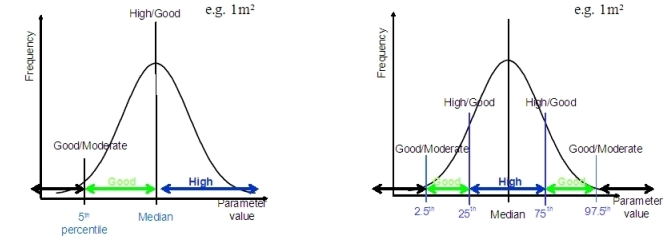
For the parameter number of species and similarity a one-sided evaluation approach (only values lower than the reference are evaluated in the high-bad gradient) is used, whereas for the parameters density and biomass a two-sided evaluation approach (values lower or higher than the reference are evaluated in the high-bad gradient) is used.
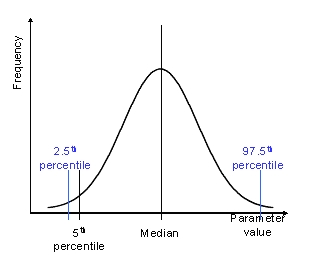
The reference boundary values for the different parameters are determined from the randomization plots. The reference value of the good/moderate boundary is determined based on the 5th percentile (number of species, similarity) or on the 2.5th and 97.5th percentile (density, biomass) out of the permutation distribution of each parameter (Ysebaert et al. subm.). The moderate/poor and poor/bad reference value were determined by equal scaling (respectively 2/3 or 4/3 and 1/3 or 5/3 of the good/moderate reference value), whereas the median value (number of species, similarity) or the 25th and 75th percentile (density, biomass) out of the permutation distribution was used as the reference value of the high/good boundary.
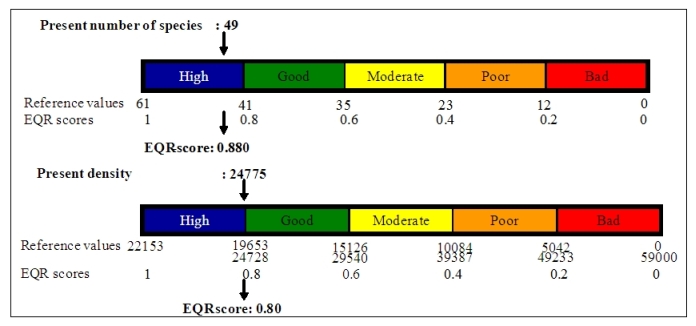
An example of the evaluation at level 3 is illustrated below.
Additionally, the BEQI also produces a list of species that are responsible for observed deviations from the reference state, which give additional insight into how the current state has changed per parameter
A list of species which are responsible for observed deviations from the reference state (a list of species that contribute most to the dissimilarity between reference and assessment) is determined for the parameters similarity, density and biomass. For the parameter density and biomass both the positively and negatively affecting species are listed. For the parameter number of species, the species that are found in the assessment data and not in the reference data are listed.
More info on the BEQI method and its applications can be found in the following publications:
Van Hoey, G.; Drent, J.; Ysebaert, T.; Herman, P. (2007). The Benthic Ecosystem Quality Index (BEQI), intercalibration and assessment of Dutch coastal and transitional waters for the Water Framework Directive: Final report. NIOO Rapporten, 2007-02. NIOO. 244 pp. details
Ysebaert, T.; De Mesel, I.G.; Herman, P.M.J. (2008) Kaderrichtlijn Water - Achtergronddocument zoute macrofauna 2008. Versie januari 2004. Wageningen IMARES Rapport, C076/08. Wageningen IMARES: Yerseke, The Netherlands. 73 pp. details
Ysebaert, T.; Herman, P.M.J. (2003) Het beoordelen van de ecologische toestand van kust- en overgangswateren aan de hand van benthische macro-invertebraten (macrobenthos). NIOO-CEME Report, 2003-05. Nederlands Instituut voor Ecologie: Yerseke, The Netherlands details
Expertteam Macrofyten en Fytoplankton (2004). Achtergronddocument referenties en maatlatten waterflora. Stichting Toegepast Onderzoek Waterbeheer (STOWA): The Netherlands. 128 pp. details
Expertgroep Macrofauna (2004). Achtergronddocument referenties en maatlatten voor macrofauna. Stichting Toegepast Onderzoek Waterbeheer (STOWA): The Netherlands. 111+ bijlagen pp. details
Altenburg, W.; Arts, G.; Baretta-Bekker, J.G.; van den Berg, M.S.; van den Broek, T.; Buskens, R.F.M.; Bijkerk, R.; Coops, H.; van Dam, H.; Van Ee, G.; Evers, C.H.M.; Franken, R.; Higler, B.; Ietswaart, T.; Jaarsma, N.; de Jong, D.J.; Joosten, A.M.T.; Klinge, M.; Knoben, R.A.E.; Kranenbarg, J.; Van Loon, W.M.G.M.; Noordhuis, R.; Pot, R.; Twisk, F.; Verdonschot, P.F.M.; Vlek, H.; Wolfstein, K.; Backx, J.J.G.M.; Beers, M.C.; Buijse, A.D.; Duursema, G.; Fagel, M.; De Leeuw, J.; van der Molen, J.; N (2007). Referenties en maatlatten voor natuurlijke watertypen voor de Kaderrichtlijn Water. Stichting Toegepast Onderzoek Waterbeheer (STOWA): Utrecht, Nederland. 375 pp. details
Ysebaert, T. (2007). Nota: Referenties en maatlatten voor macrobenthos van overgangs- en kustwateren: aanvullende informatie t.b.v. RWS-rapportage. Wageningen IMARES Rapport, C110/07. Wageningen IMARES: Wageningen, Nederland details
Van Hoey, G. (2008). Assessment of the Lower Saxonian monitoring stations using the BEQI. ILVO: Belgium. 34 pp. details
Van Hoey, G.; Derweduwen, J.; Vandendriessche, S.; Parmentier, K.; Hostens, K. (2009). How will the ecological quality status of benthos in coastal waters evolve (ECOSTAT)?. ILVO: Belgium. 63 pp. details
Van Hoey, G.; Wittoeck, J.; Hillewaert, H.; Van Ginderdeuren, K.; Hostens, K. (2008). Macrobenthos monitoring at the Belgian coast and the evaluation of the availability of reference data for the Water Framework Directive. ILVO: Belgium. 72 pp. details
Van Hoey, G.; Pecceu, E.; Derweduwen, J.; De Backer, A.; Wittoeck, J.; Hillewaert, H.; Vandendriessche, S.; Hostens, K. (2009). Macrobenthos monitoring at the Belgian coast in 2008, in accordance with the Water Framework Directive. ILVO: Belgium. 101 pp. details
Twisk, F.; van Loon, W.; Ysebaert, T.J.; Herman, P.M.J. (2009). KRW-beoordeling van macrofauna in kust- en overgangswateren met BEQI. H2O 19: 34-37 details

 A habitat specific approach is furthermore strongly recommended by
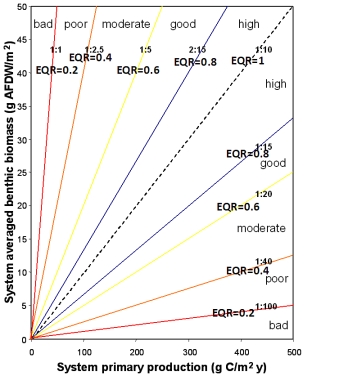
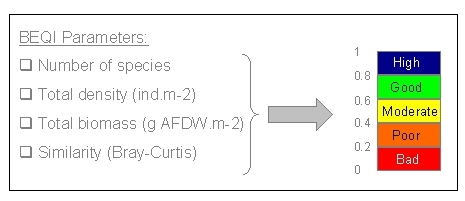 total biomass (g AFDW.m-2), and similarity (Bray-Curtis similarity based on 4th root transformed density data). The similarity index compares the assessed species composition (species and their densities) with a reference species composition. Each parameter gives different information about the structure and functioning of the benthic community (Ysebaert et al. subm.).